
One Sample T-Tests using SPSS
- Open your SPSS file.
- Click on Analyze.
- Click on Compare Means.
- Click on One-Sample T Test .
- Highlight the variable of interest and slide into the box labeled 'Test Variable' (red arrow below).
- Enter a value in the box labeled Test Value; this is the expected value of the population parameter (purple arrow below).
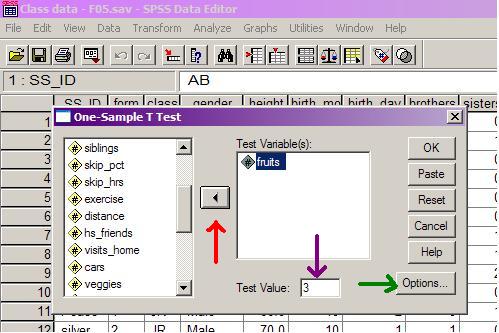
- Click the Options button (green arrow above).
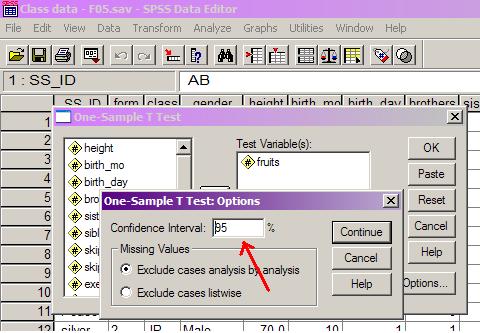
- Enter the value for alpha (e.g., 95% if alpha equal .05); see red arrow above.
- Click Continue, then OK.
- Note the observed value for t, the degrees of freedom, the SEM, and the p-value circled below.
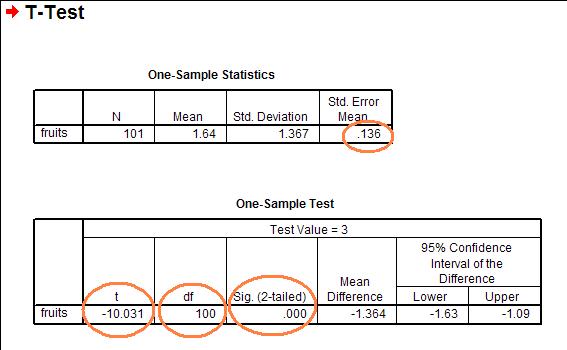
- You can then cut and paste the tables into Word as before.