
Calculating CIs using SPSS
- Open your SPSS file.
- Click on Analyze.
- Click on Compare Means .
- Click on 1-Sample T Test .
- Highlight the variable(s) of interest (TV network, Weekday Bedtime, and Weekend Bedtime).
- Click the arrow (red arrow below) to slide them across the dialog box.
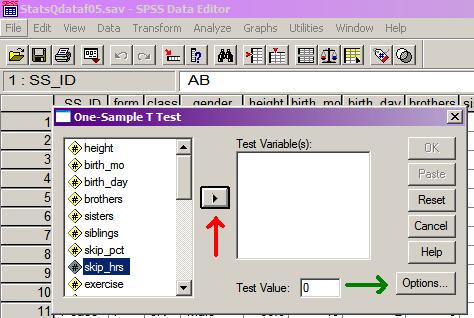
- Click the Options button (green arrow above).
- Enter the value for the CI you wish SPSS to calculate (e.g., 95%).
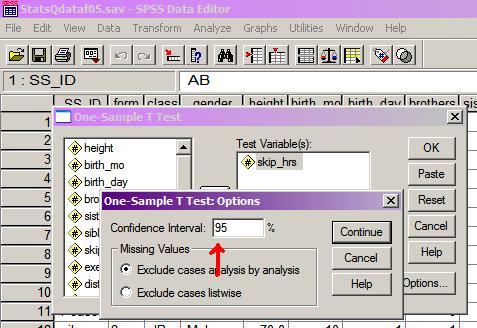
- Click Continue, then click OK.
- Note the upper and lower boundaries of your confidence interval.
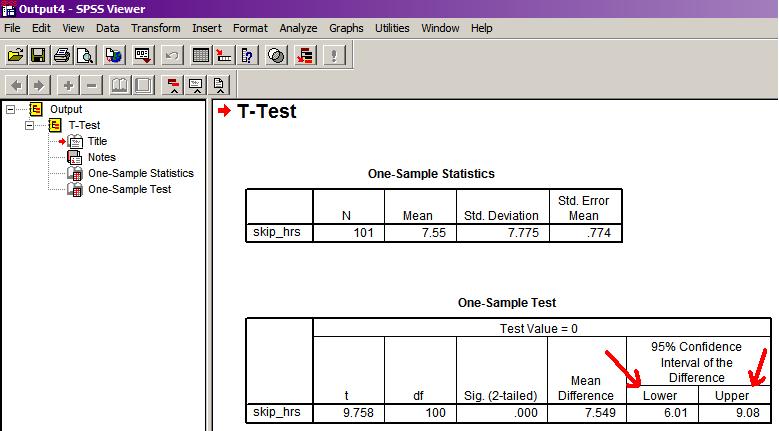
- You can then cut and paste the table into Word as before.