Repeated Measures ANOVAs using SPSS
- Open your SPSS file.
- Click on Analyze.
- Click on General Linear Model .
- Click on Repeated Measures.
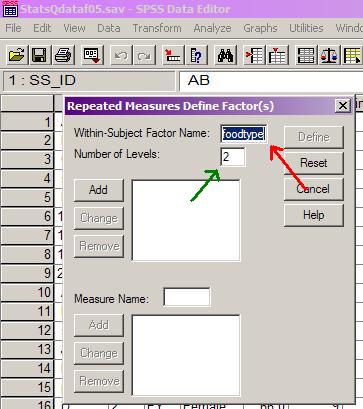
- Enter the name of your independent variable in the box labeled 'Within-Subject Factor Name' (red arrow below).
- Enter the number of levels in the box labeled 'Number of Levels' (green arrow below).
- Click 'Add', then 'Define'
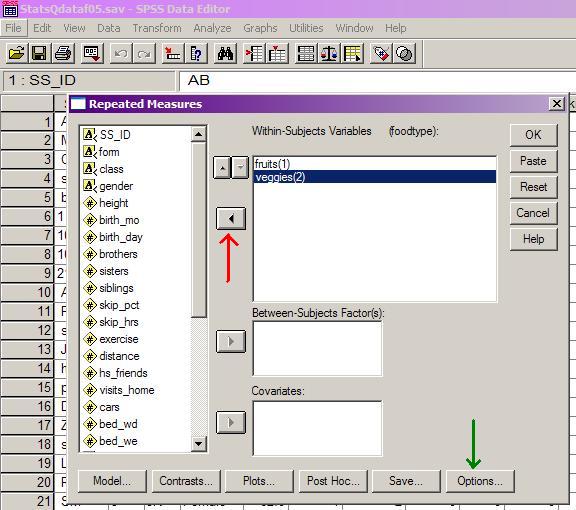
- Highlight the various levels of your independent variable and slide them into the box labeled 'Within Subjects Variables' (red arrow below).
- Then click the Options button (green arrow below).
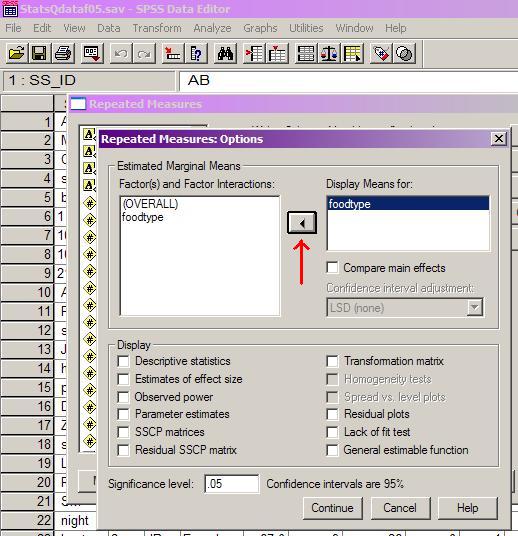
- Highlight the independent variable and slide it into the box for 'Display Means for:' (red arrow below).
- Click Continue, then OK.
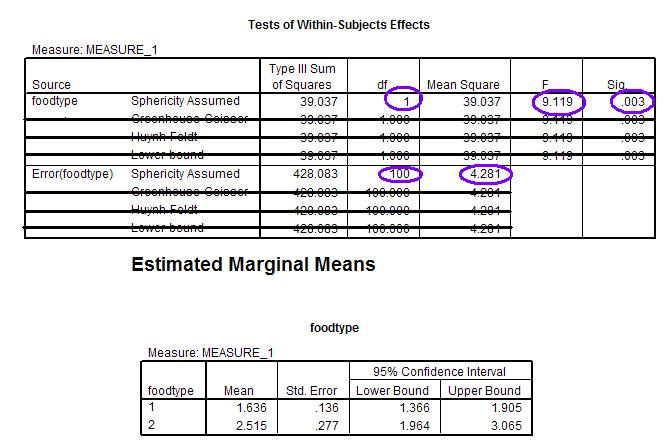
- Note the observed value for F, the degrees of freedom for the numerator and the denominator, the MSE, and the p-value.
- The means appear in the table at the bottom. Normally, I would have to give you a value for Tukey's HSD, but for this hoemwork assignment, there are only 2 levels of the independent variable, so once you reject the null, you know that the two conditions are significantly different from one another.