Simple Regression using SPSS
- Open SPSS.
- Click on Analyze.
- Click on Regression .
- Click on Linear.
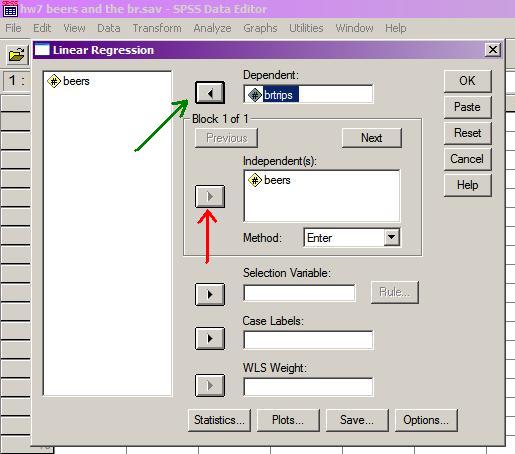
- Enter the name of your independent variables in the box labeled 'Independent(s)' (red arrow below).
- Enter the name of your dependent variable in the box labeled 'Dependent' (green arrow below).
- Click OK .
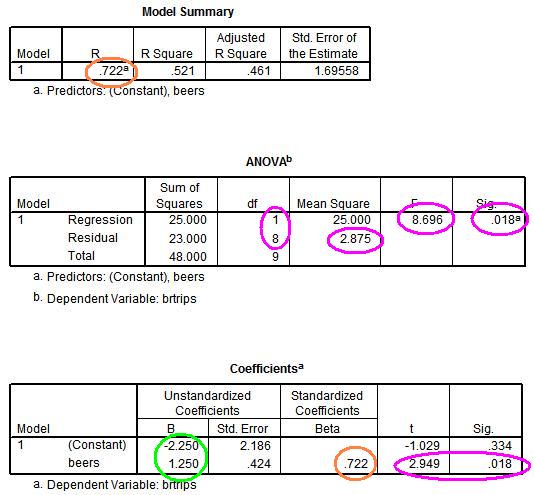
- The output for your Regression model appears below.
- The pink circles in the middle table indicate the results of the ANOVA to determine whether Beer is a significant predictor of trips to the BR. The pink circle in the bottom table indicates the results of the analogous t-test to determine if the slope parameter / correlation coefficient is significantly different from zero. Notice that the p-value is the same and the observed value of t is the square root of the observed value of F.
- The green circle in the bottom table indicates the values of the y-intercept (B0) and slope (B1). The y-intercept is located in the row labeled 'Constant'; the slope is located in the row labled by the independent variable (beers).
- Finally, the correlation coefficient is located in two places (the orange circles in the top and bottom tables).