
Independent T-Tests using SPSS
- Open your SPSS file.
- Click on Analyze.
- Click on Compare Means.
- Click on Independent Samples T Test .
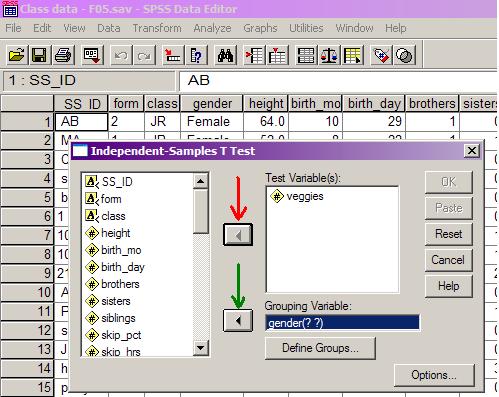
- Highlight the dependent variable and slide into the box labeled 'Test Variable' (red arrow below).
- Highlight the independent variable and slide into the box labeled 'Grouping Variable' (green arrow below).
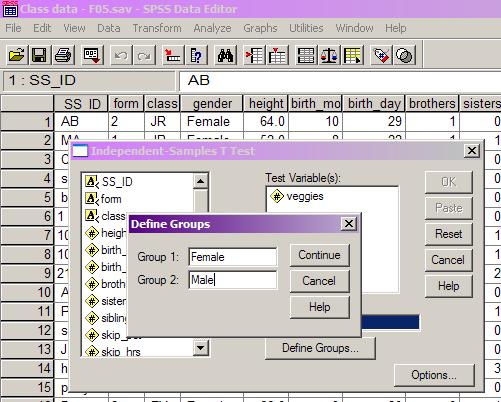
- Click Define Groups, and fill in the names of the different levels of the independent variable; then click Continue, then OK.
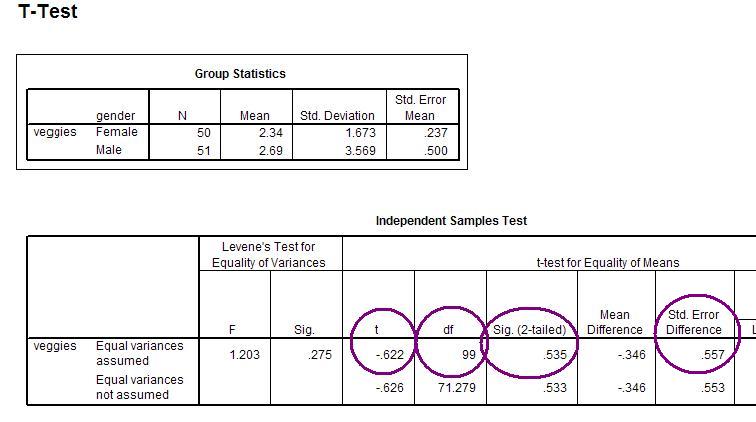
- Note the observed value for t, the degrees of freedom, and the p-value circled below.
- You can then cut and paste the tables into Word as before.