| Final Project Overview. The goal of the final project is to give you an opportunity to demonstrate the skills that you have acquired this semester in terms of both analyzing and interpreting data. To that end, you will be asked to draw upon material from across the semester. You will use SPSS to calculate descriptive statistics, t-tests, ANOVAs, correlations and simple and multiple regression analyses. That seems like a lot, but you won’t have to do any calculations by hand, which should save you time. Everything will be analyzed using SPSS and a data set that I have collected over the last couple of years.
The Data Set. As I have mentioned in class, I have collected a set of data on the basis of my Wordle play on the NY Times website. For those of you who are unfamiliar with Wordle, it is a word game where you try to guess a five-letter word by entering five letter words. Each time you guess, the computer tells you how many letters you have correct and whether those letters are in the correct location. The goal is to use that information to guess the word in as few guesses as possible. The game is free so if you are unfamiliar with Wordle, you might go ahead and try it for a couple of days, just to get the hang of it. You don’t really need to know anything about Wordle for the final project except that fewer guesses are better than more guesses.
I collected data for 200 days. For half of the days, my first word was DRONE. I love Drone as a first word; it is my ride or die for Wordle. For the other half of the days, I used SLATE because according to the NYTimes’ Wordlebot, SLATE is one of the best opening words that you can use; even so, I still prefer DRONE. The Wordlebot is a ‘bot’ that evaluates your game play every day. It gives you two ratings for every game you play.
- Skill - did your guesses help you eliminate as many potential solutions as possible, thereby getting you closer to the solution). Skill is rated on a scale from 0-100; higher numbers indicate more skill.
- Luck - did your guesses eliminate possible solutions by chance rather than by skill. Luck is also rated on a scale from 0-100; again, higher numbers indicate more luck.
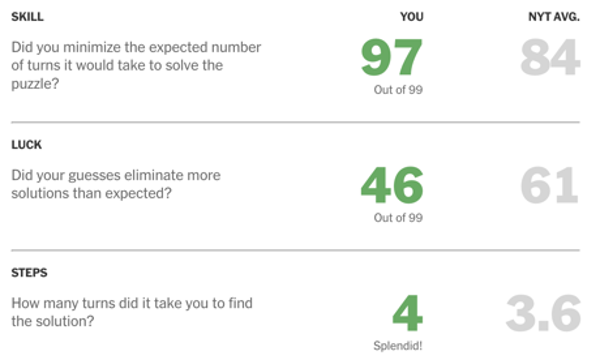
I don’t really know much about how these calculations are made, but we are not going to worry about that. The other thing the Wordlebot tells you is how you compared to the average NY Times Wordle player for any given day. Here is an example of the information you get. On the day depicted below, my skill score was very high: 94; the NYT average was 84. My luck score was kind of low: 46; the NYT average was 61. Overall, it took me 4 guesses to get the correct solution (it was NICHE in case you are wondering), which was slightly worse than the NYT average which was 3.6 guesses.
As I mentioned, the data set includes 200 entries. The first 100 days, I used Drone as my starting word; for the next 100 days, I used Slate as my starting word. The data set includes eight variables:
| Day |
Just a number differentiating the days; you can ignore this. |
| TDSkill | My Skill rating for that day. |
| TDLuck | My Luck rating for that day. |
| TDScore | The number of turns I needed to solve the Wordle. |
| NYTSkill | The average Skill rating for NY Times readers for that day. |
| NYTLuck | The average Luck rating for NY Times readers for that day. |
| NYTScore | The average number of turns that NY Times readers needed to solve the Wordle. |
Final Project questions. There are six questions on the final project:
- Descriptive Statistics
- T-test
- ANOVA
- Correlation and simple regression
- Multiple regression
- Summary
Each question contains multiple parts. You must explain your answer for each question, using statistical analyses when appropriate. You also must interpret and report the results of those analyses using proper notation. If I was working in a group, I would assign different people to each question, then come together to review the answers together; use that time to check and double-check each other’s work. Question 5 includes a Bonus question that is DIABOLICAL; don’t spend too much time on it.
Logistics. Please type out your responses and submit as a google doc using 12-point, Times New Roman font; paragraphs should be single-spaced. There is a link to submitting the final project assignment on the course web page. Graphs can be cut and paste into the google doc. Please come talk to me before the start of finals period if you anticipate any problems submitting a google doc.
You may work on the project in groups of up to 3 (three) people. You only need to turn in one copy of the assignment per group but be sure to include the names of ALL group members on the final google doc.
Please make liberal use of office hours. I will be in my office quite a bit during reading period and finals period; we can also meet via Zoom. I will be VERY willing to help you with the mechanics of SPSS. Don’t let the fact that you can’t quite remember how to get SPSS to do a repeated measures ANOVA slow you down. Ask for help! I also built a set of online tutorials (see links below) to remind you how to conduct SPSS analyses AND how to report the results of analyses using proper notation. Use that resource, as well.
I know that every professor tries to convince you that a final exam/project is a wonderful opportunity to demonstrate your learning. I may have even tried to slip that into the first sentence of this document. I know that finals period is tough. I also know that y’all have done a lot of work for this class already and I’m very pleased with what y’all have done thus far. The final project is not meant to be a huge lift. That is one of the reasons I’m giving you the opportunity to work in a group; to lighten the load a bit. If it is feeling overwhelming, use office hours to help make the load even a little lighter. That is one of the reasons I am here.
Good luck, my friends. I’m rooting for all of you to ace the final project.
|